
VIEW 01
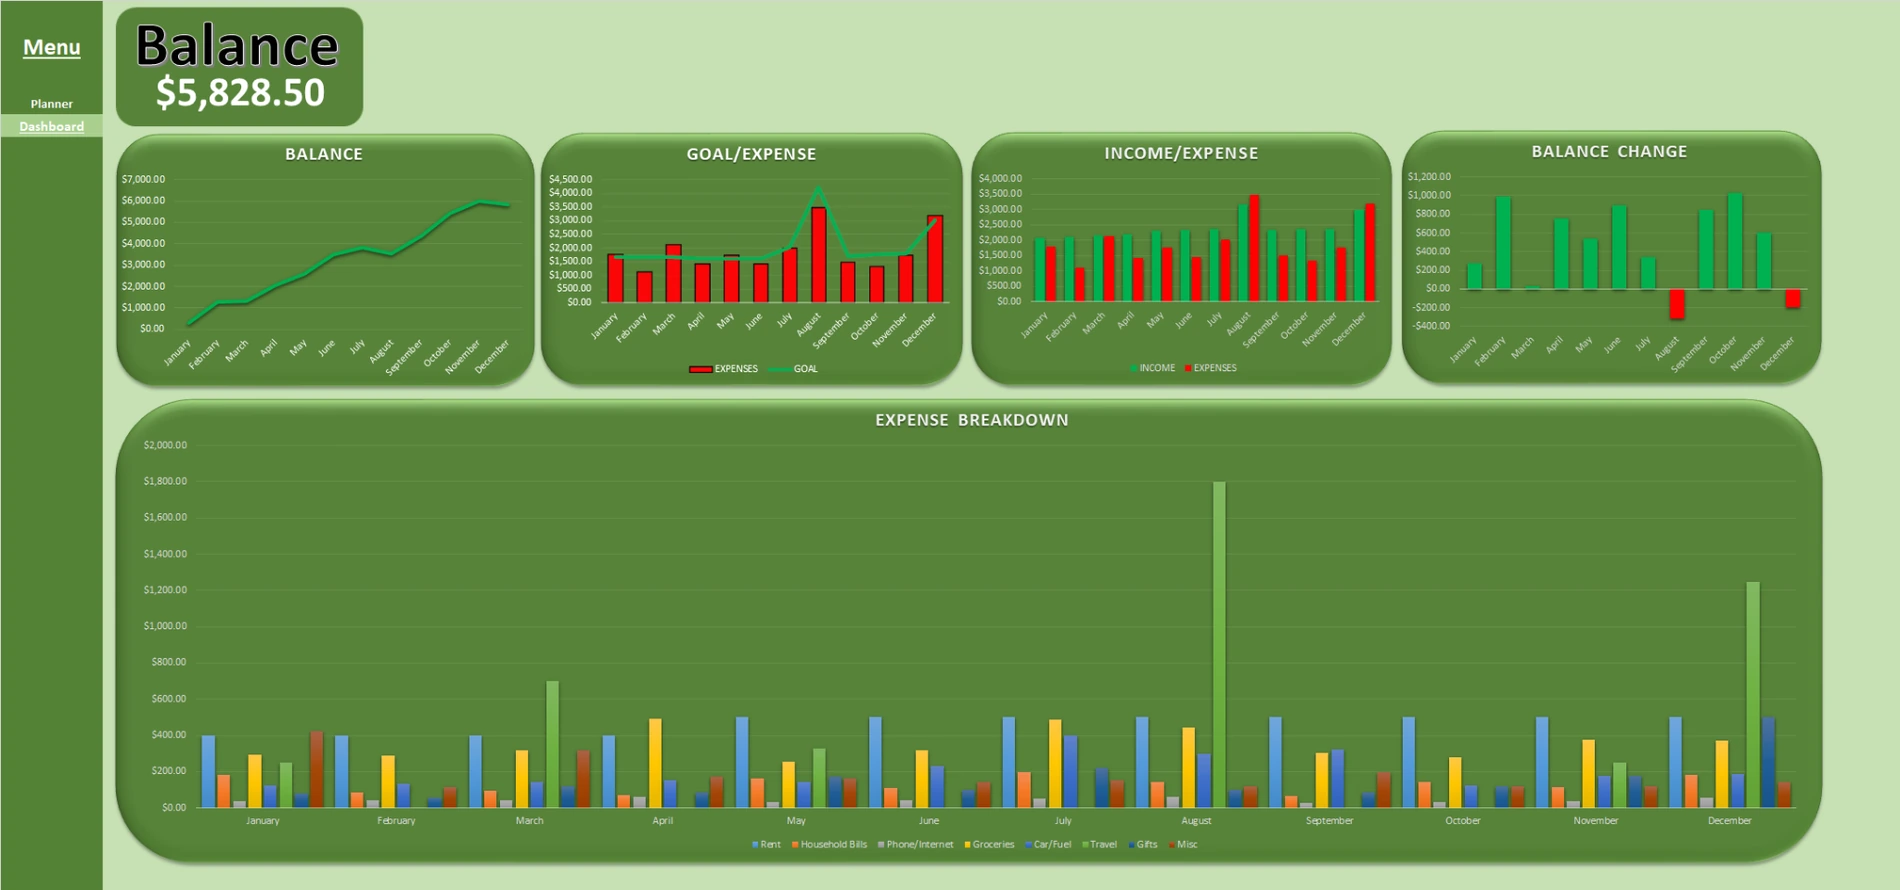
Savings and expense dashboard
A 12-month view of balance, expenses versus goals, income versus expenses, monthly balance change and spending by category.
An Excel financial-planning workbook that turns month-by-month income, household spending, budgets and savings targets into an easy-to-read dashboard.
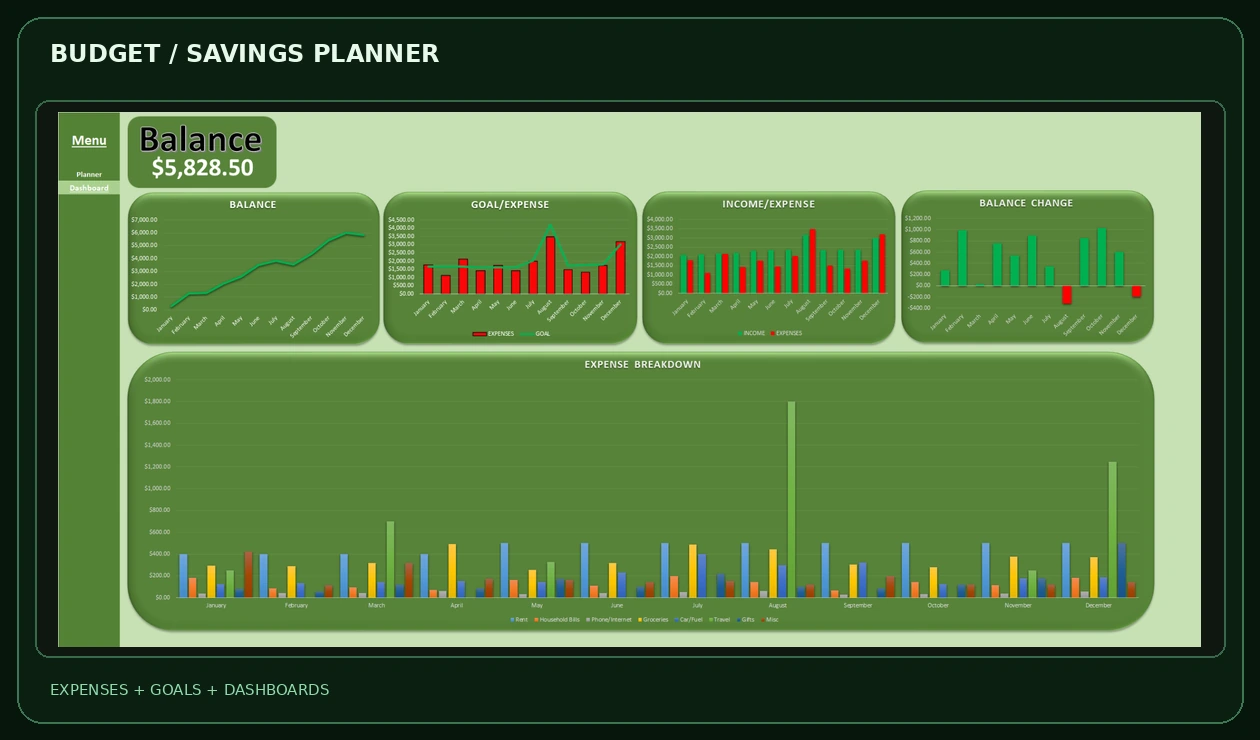
Both images were supplied directly from the Excel file and already contain illustrative amounts. No additional totals, chart bars or labels were painted onto the screenshots.
A 12-month view of balance, expenses versus goals, income versus expenses, monthly balance change and spending by category.
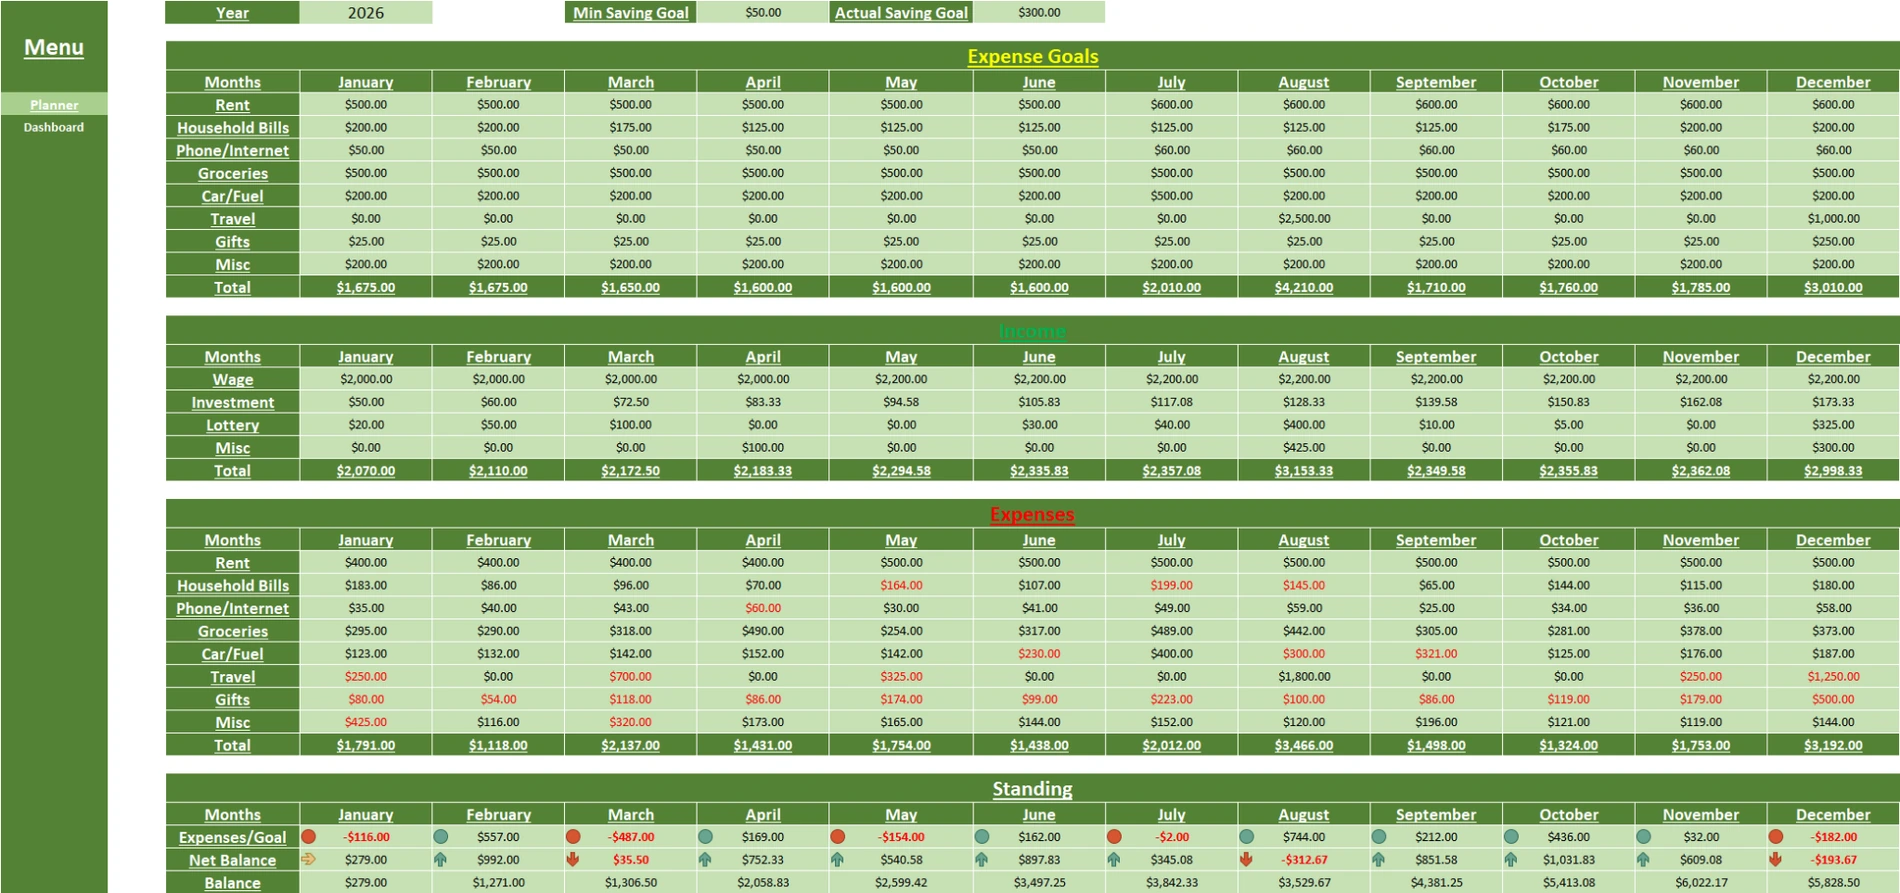
Plan expense goals and saving targets, enter monthly income and actual spending, and review differences and balances across the year.
The planner separates targets from actual results so someone can understand where money is going and how their savings change over time.
Budget categories include rent, bills, groceries, transport, travel and other monthly items.
Actual expenses, income and balance figures are organized in a monthly grid.
The dashboard summarizes trends and composition without requiring the user to interpret raw rows.
The dashboard and planner screenshots are supplied originals with sample amounts. These values are illustrative; the site does not present them as a customer’s real financial results. The workbook was reviewed structurally, not independently recalculated in desktop Excel.
Share the current workflow, expected outputs and what takes the most time. I’ll help scope an Excel-first solution.
Start a project inquiry ↗